In this tutorial, we show you how to display all the values from an EV3-G array on the EV3 brick display. We are using an array Read Operation along with a loop. We are also detecting the loop counter and using it as an index to an array. It's basically the only viable way to do it. The process is commonly referred to as - "Iteration over an array" (although we still do not have an iterator in the programming language, we promise that one day we would do the super advance videos on "iteration" using the LEGO MINDSTORMS robots")
- #644
- 04 Oct 2017
- 6:05
- LEGO MINDSTORMS, LEGO MINDSTORMS EV3
- FIRST LEGO League, EV3-G, Sensors, Display, EV3, Array, Light and Color Sensor, FLL, Programming
Loops have a counter
Each loop in the EV3-G software and in almost all other programming languages have a counter. The counter counts the number of times the body of the loop is executed. The number of times you 'loop'. When you do it for the first time you've looped 0 times. You have executed the body of the loop exactly 0 times. When you enter the loop a second time the counter is 1 because you've executed the loop 1 time and you are now at the second execution.
So the counter starts from 0 and increments. This is very convenient considering that arrays indices also start from 0.
On the picture below we set the loop to increment to 8 and after the 8 execution of the loop, it will stop. This means the counter will have the following values - 0,1,2,3,4,5,6,7. These are 0 to 7. Because 0 to 7 are 8 executions of the array.

Arrays start from 0
The index of the first cell in an array is 0. The index of the second cell is 1. The index of the third cell is 2. This is very convenient when using counter in a loop. You can directly take the output from the counter and add it as an input in the array index. In this way, on each iteration of the loop, you would index the next cell.

Calculate position on the screen
Each new value should be at a new position on the screen. If we do not place the text on a new position we will see only the last value. What we are doing is moving from up to down and showing each value below the previous. We are incrementing the Y value of the display. To do the incrementation we again use the counter. By multiplying the value of the counter is 15 we get the new values for the Y. The coordinates on which the values will be displayed are
Counter -> Y position
0 -> 0 (0*15)
1 -> 15 (1*15)
2 -> 30 (2*15)
3 -> 45 (3*15)
4 -> 60 (4*15)
5 -> 75 (5*15)
6 -> 90 (6*15)
7 -> 105 (7*15)
Here is the actual calculation with the EV3-G software.

English
Currently we display the values for minimum and maximum only for the sensor connected on port 4 and in this tutorial we'd like to display all the values from the array. These are eight values and to have them right here in the first column. Let's see how we can do this with the EV3-G software. This here is the program that we have for finding the minimum and maximum value for the four different sensors. This is the whole program and at the end of the program we have some kind of logic for displaying the values that are in cell 2 and cell 3, with index 2 and 3. So, these are displaying for the second sensor. What I'd like to do is to display all the values in the array. The first thing that we need to do is to first clear the display.
So, we come here and we clear the display. Then in a loop because we want to display eight different values we'll set the loop to loop until the counter is less than 8. So, this loop will loop for 8 times. And in this loop I'd read the numeric array
then we'll pass this numeric array to the read operation and we want to read the first time the cell with index 0, then the cell with index 1, then the cell with index 2. So, we'll just pass. Right here we have this output that gives us the count of the loop - How many times we have looped. The first time it is 0, the second time it is 1, the third time it is 2. And we just pass this as an index that would like to read from the array. And then as we read the index we want to display the value that we read from the array.
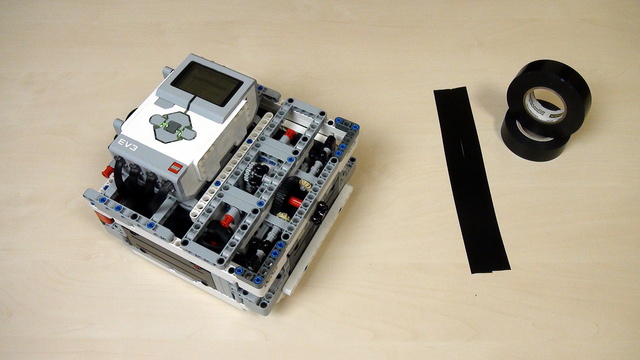
This here is the read and we don't want to clear it. So, we can execute this but the problem is that each of the values will be displayed on X0 and Y0. So, at the end we'll see only one value at the display. What we can do is to use an operation, a mathematical operation and to do some calculations. We'll take the count from the loop and we'll take the count set and we'll multiply this by 15. And then this is the position that we want to display this value. And we have the position as 'Y', so this is the vertical position of the text. So, on the first execution of the loop we'll have the count that is 0, multiplied by 15, so 0 multiplied by 15 and it will be displayed on (0,0). The second time the count will be 1, the result from the multiplication will be 15, and the next value will be displayed on (0,15), then (0,30), then (0,45), then (0,60) and so on. And because we don't have enough space on the display we'll use the font size 1. And in this way we can display all the 8 values from our array on the screen. And this is an algorithm that you can use also for other arrays and you can do some other multiplications here to calculate the X and Y to display values from an array to the screen. Let's download and run this program. Place the sensors before a black line because our robot is moving back. Download the program.
The program starts and we detect the minimum and maximum for all the four sensors. And what you can see is:
The first sensor detects -2 and 0 because this is a gyro sensor. And you can not calibrate the gyro sensor in the same way you are calibrating the light sensors. And for the next 3 light sensors we have minimum values 6, 6, 4 and maximum values 77, 80 and 76. So, these are the minimum and maximum values detected by the color sensors and from then we can have a calibrated value using these sensors. This is something that we'll show in the next tutorial. But first as an example If we don't move over the black line, if I just leave the robot here and move back, what will happen is that after a second we'll see minimum and maximum values that are the following. We have 75, 76 and 73 are the minimum values detected by the sensor. And 77, 79 and 76 are the maximum values detected by the sensors. These are sensors on port 2, 3 and 4.
Next we want to actually move, calibrate and then stop on the black line using a new calibrated value.
Courses and lessons with this Tutorial
This Tutorial is used in the following courses and lessons
FIRST LEGO League Competition. Constructing and Programming a Robot Base
This course if used by teams, mentors and students to structure the preparation for the Robotics Game of the FIRST LEGO League Robotics Competitions. One thing that is common each year at FLL is that experience matters a lot. Our goal with this course is to quickly bring new teams up to speed with experienced teams and to share some new tricks, patterns, constructions with the more experienced teams.
- 42
- 249:53
- 10
Advanced Light/Color Sensor Calibration
Would you like to resolve all the problems with the light/color sensors that you have? And to make all of them work in a predictable, stable way even when using more than one MINDSTORMS colour sensors.
When using Color sensors it is important to calibrate them depending on the light conditions in your venue. In this way, the calibrated sensor will show values between 0 and 100 independent of the light conditions. But using the default EV3 colour calibration available in the colour sensor block could lead to unpredicted problems that are difficult to track and resolved especially when used with multiple Color sensors. So in this series of tutorial we implement the calibration ourselves discussing the principles of colour sensor calibration.
- 15
- 0
- 4
- 3d_rotation 0